Every stock came back 'wait'. The prices were split-adjusted and the earnings were not
StockLens is a local research tool I built for my own investing in Indian listed stocks. A Screener.in export and a company's transcripts go in, and a cited report ending in a stance comes out. The arithmetic is plain Python, a 10-node LLM pipeline writes the narrative, and code rejects any claim whose source id is not in the evidence. One user, 28 stored reports across 18 stocks as of 2 September.
- Client
- Personal project
- Role
- Sole developer
- Year
- 2026
- Stack
- PythonFastAPIOpenAI Responses APINext.jsMySQLWeaviateLangfuse
- Reading
- 15 min
Context
I research Indian listed stocks for my own investing, and the loop was always the same. Export about ten years of financials from Screener.in as an Excel workbook, download the latest earnings-call transcript and investor deck, sometimes the annual report, then read all of it and decide whether the company deserves more time. A first read took me about an hour a stock, by my own estimate. StockLens is the tool I built to do that first read with me. Nobody asked for it. It is a personal project with one user, and it runs only on my machine.
The design notes I wrote on day one name three hard parts, and none of them is LLM reasoning. Getting numbers out of PDFs and decks accurately. Not hallucinating financial figures, which means every number cites a document and the arithmetic happens in code. And keeping data consistent across reporting standards.
The constraints were one developer, working with Claude Code assisted programming. About three weeks of activity, from 11 August to 2 September 2026, and I still use it. Local-only by requirement, because traces contain filing text and financial data, so hosted observability was out. That puts nine containers on one Windows machine with 16 GB of RAM. India only: an upload needs an NSE or BSE ticker or it is rejected. The first plan covered US stocks as well and I cut it.
Every report ends in a stance: enter, wait or avoid for a stock I do not hold, and add, hold, trim or exit for one I do. It is a research aid for one person. Nothing on this page is investment advice. I do not name any company I used it on, and every company in the screenshots below is invented.
Approach
The rule that shapes everything is that code computes and the model narrates. Ratios, forensic checks such as cumulative operating cash flow against profit, capital allocation, the valuation histories, a fair-value band, a reverse DCF solved by bisection and the price-action classification are all plain Python with no LLM involved. Each result is registered under a computed: id, so the model cites a number instead of deriving one.
The system is in Figure 1. An upload is hashed, so identical bytes are a no-op. A Screener workbook is recognised by its sheet names, and PDFs are typed by one light LLM call for the whole batch. Statements from a Screener workbook are parsed in code. Statements from a PDF go through text extraction and an LLM, then a cheap structural check: assets must equal liabilities plus equity within 2%. A failure gets one strict retry on the heavy model, and if that fails too the filing is stored and flagged for review. Narrative text is split into paragraph-aware chunks of about 500 tokens and indexed in Weaviate for hybrid BM25 and vector search. Each new transcript gets a summary with guidance, Q&A highlights and a label for management tone.
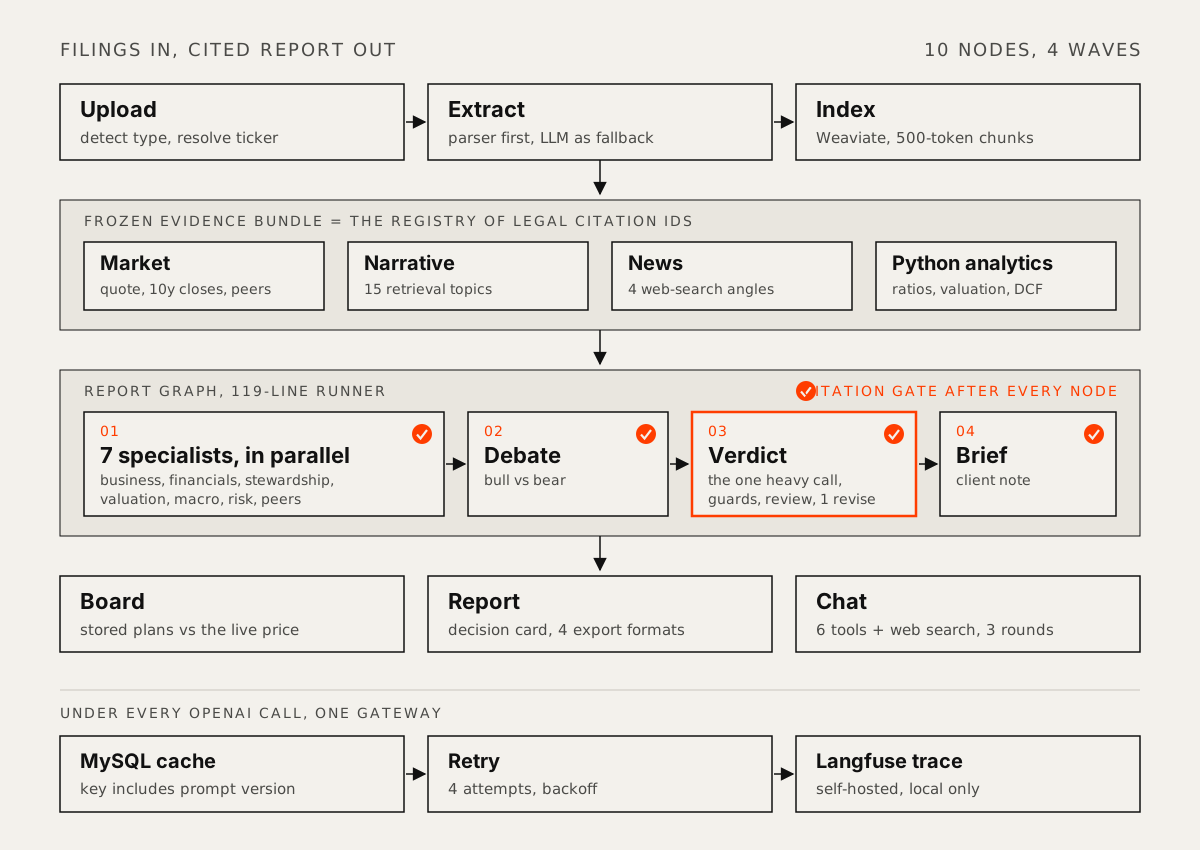
Before any report node runs, three groups of inputs are built in parallel. Market data: a quote, ten years of year-end closes with their split factors, peers and a benchmark. Narrative: 15 fixed retrieval topics, plus up to 5 more chosen by a routing call that decides what kind of business this is. News: four web-search angles in parallel, two searches each, then one merge call with no tools. Together with the Python analytics they are frozen into one evidence bundle, and that bundle is the registry of legal citation ids.
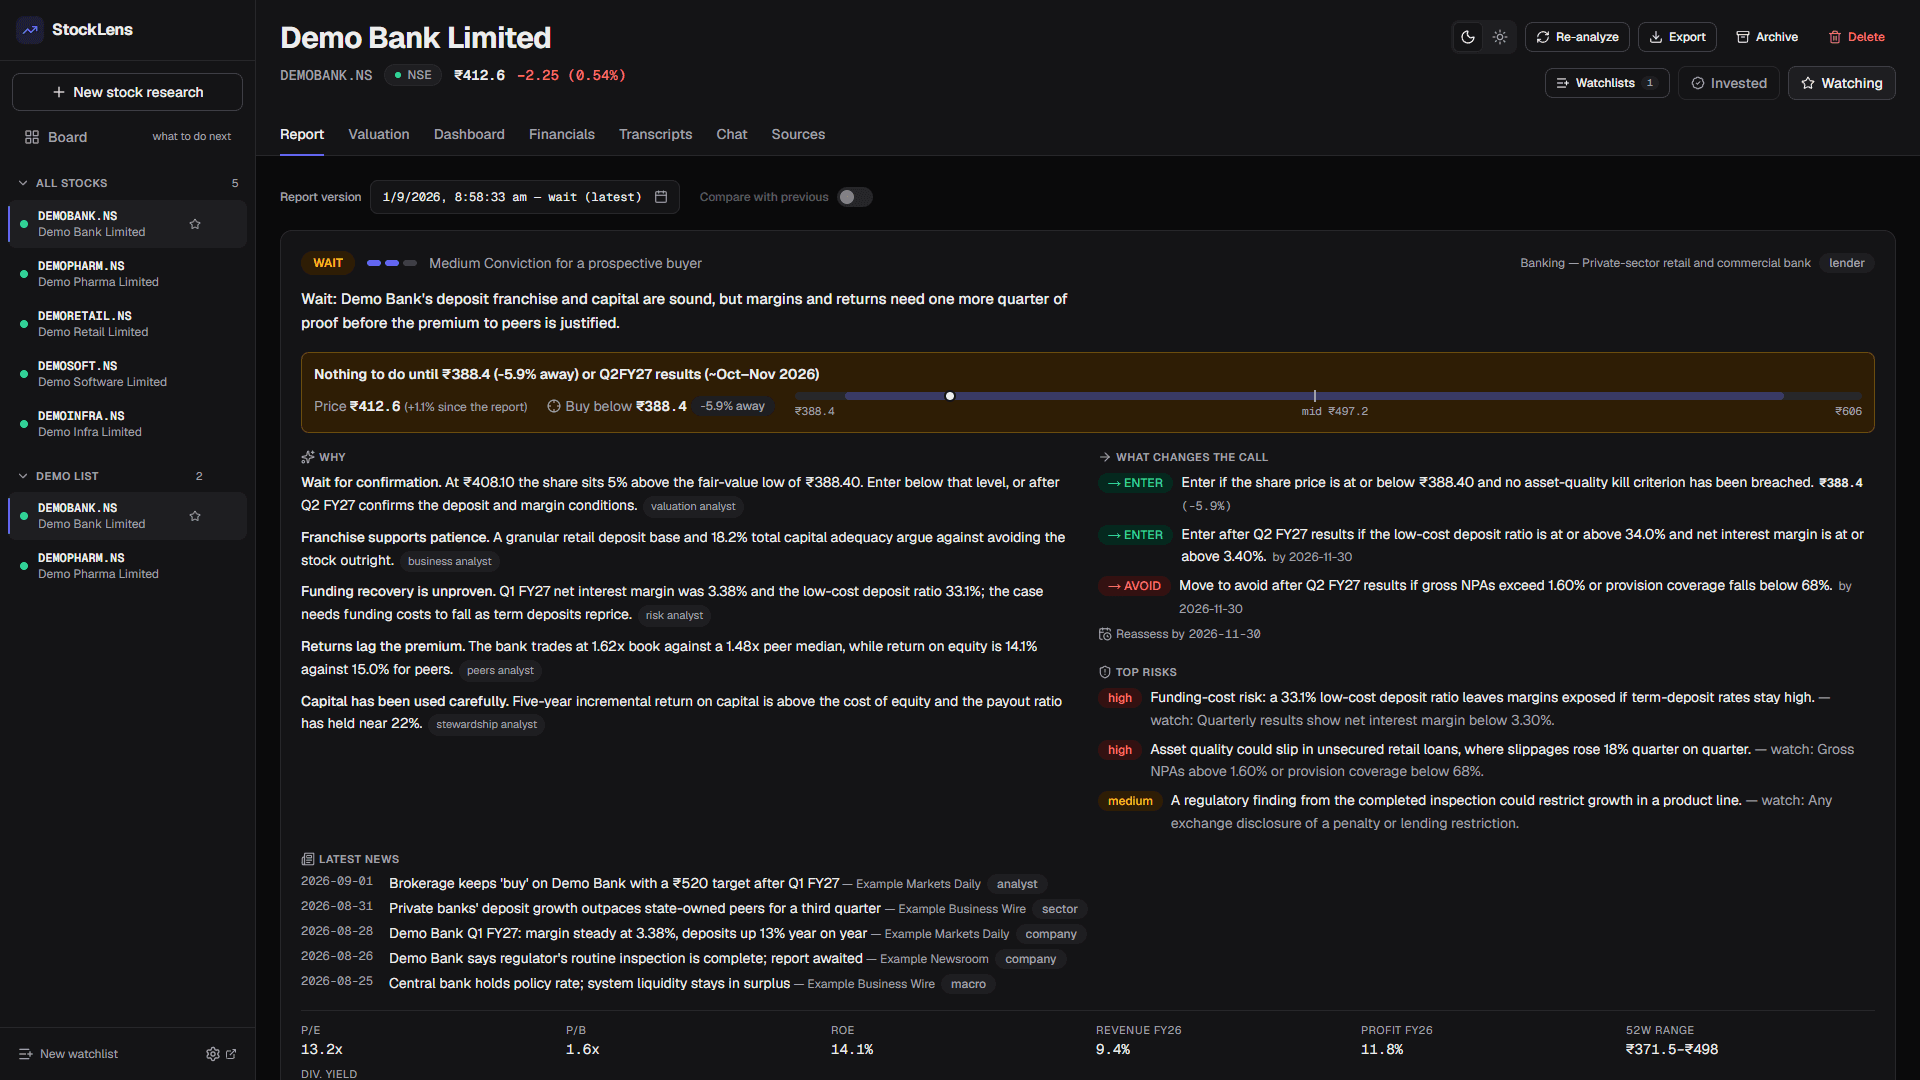
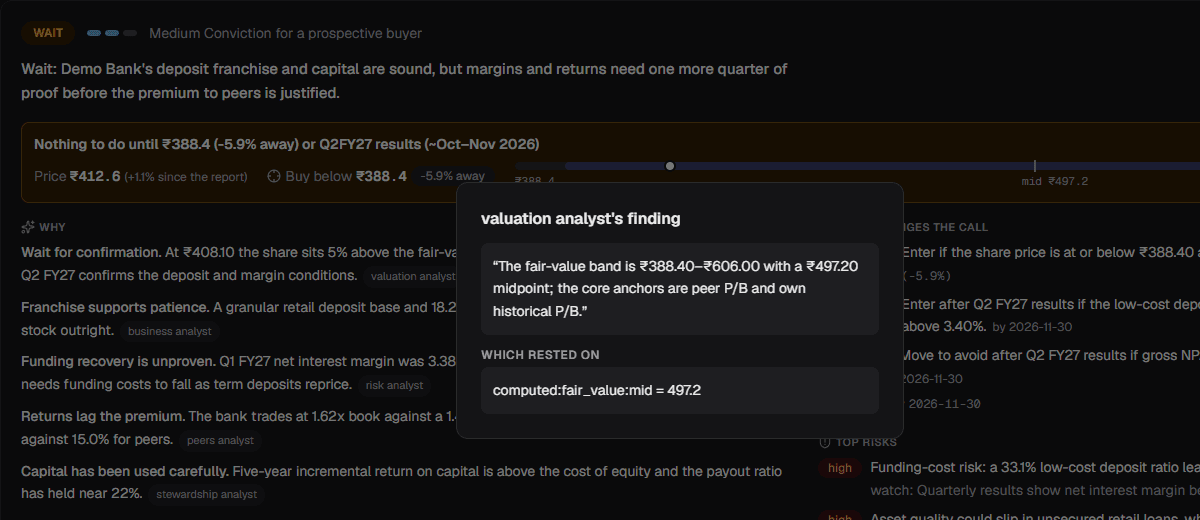
The report itself is a graph of 10 nodes in 4 waves. Seven specialists run in parallel: business, financials, stewardship, valuation, macro, risk and peers. A debate node argues bull against bear over the points that survived. The verdict is the only call on the heavy model. Deterministic guards and a review run on its output, the model gets at most one revise call, and a brief condenses the result into the decision card in Figure 2. After every node comes the citation gate: each point's source type and id must exist in the frozen registry, or the point is rejected and logged. Later nodes cite earlier findings by ids of the form analysis:{node}:{i}, so a reader can click a reason on the card, land on the specialist's finding, and see what that finding rested on. Figure 3 is one such hop.
Every OpenAI call goes through one gateway function, and no other module imports the SDK. It checks a MySQL cache keyed on a hash of the module, prompt name and version, model and reasoning effort, content and schema. It retries transport errors with backoff, four attempts. It is traced by Langfuse. A truncated response raises an error instead of returning broken JSON. Every output schema is strict: all properties required, nothing extra allowed.
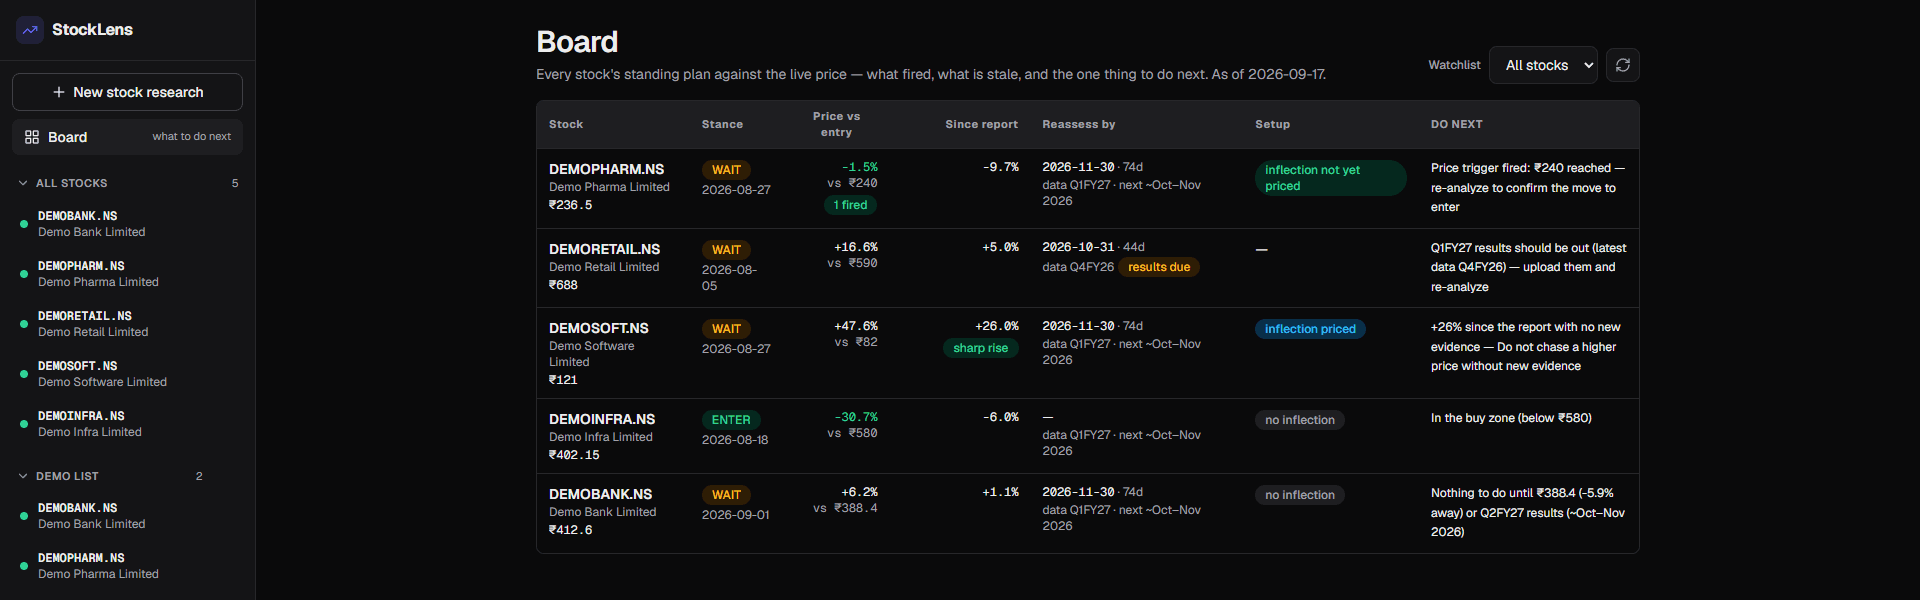
Two smaller pieces hang off the same evidence. A chat agent has six function tools and web search, with its budgets held as counters in code: three round trips, three function calls a round, two searches, and a final round with no tools. Position sizes come from a formula and never from the model. And the stored verdict's triggers are re-evaluated against the live quote and the results calendar every time a page opens, which is the board in Figure 4. There is no scheduler and no alerting, by decision.
Decisions
- Decision
- Keep Yahoo's closing prices as they come, and adjust every per-share denominator to today's share count using the split factors in the same data frame. Build the fair-value band from core anchors only: a peer or own-median multiple times EPS, or times book value for lenders. The analyst target price becomes a reference level that can be cited but never sets a bound, and an anchor outside 0.5x to 2x the median of the others is dropped. The hurdle rate went from 15% to 12%. After the verdict, code lists problems and sends them back to the model once. Whatever remains is enforced in code, which may re-anchor a trigger or cut conviction but never flips a stance.
- Why
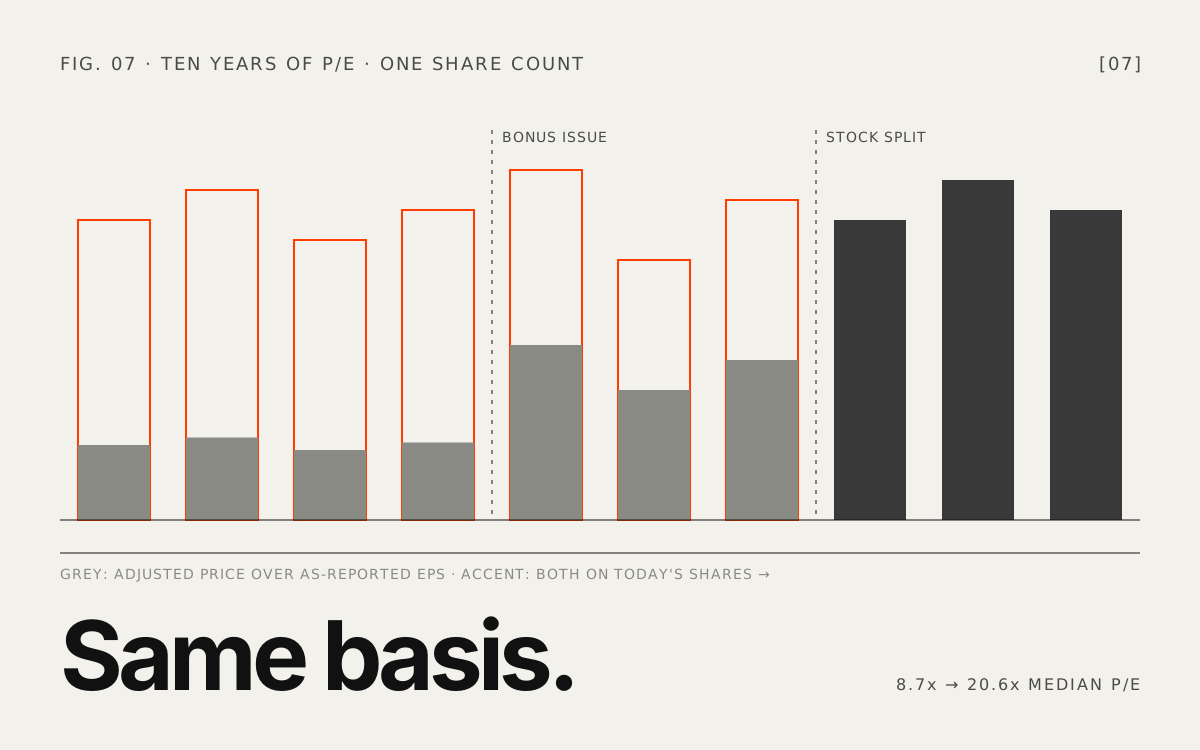
- Every stock came back 'wait' with an entry level the price was never going to reach. Yahoo's close is always adjusted for splits and bonus issues, and my code divided it by EPS and book value as reported. For one large private-sector bank, a bonus issue and a stock split had halved and then quartered every earlier year's multiples. Its own history said it had always been cheap, so today's price looked absurd.
- Tradeoff
- Own-history multiples changed for every workspace, so verdicts from before 1 September are not comparable with later ones. The review can add one more heavy-model call to a run, and on its first outing it spent that call partly on a false positive, which I come back to at the end.
The same bank, in the same workspace, from the stored runs before and after the fix:
| Before, 30 Aug | After, 1 Sep | |
|---|---|---|
| Own median historical P/E | 8.73x | 20.59x |
| Own median historical P/B | 1.27x | 3.20x |
| EPS growth a year, FY17 to FY26 | -2.07% | +14.24% on today's share count |
| Upper end of the fair-value band set by | the analyst target price | own median P/B times book value |
| Price trigger's distance from the live price | 32.9% below | 5.5% below |
| Non-price triggers carrying a date | 0 of 3 | 3 of 3 |
| Stance and conviction | wait, medium | wait, medium |
| Review record | none, the loop did not exist | 2 issues, 1 revise call, 0 enforced |
The stance did not change, and the fix was never meant to change it. What changed is that "wait" now comes with a level the price could plausibly reach and triggers that carry dates. Only runs from 26 August onwards store the distance to the nearest upgrade trigger. In the seven before the fix it was 2.1%, 16.0%, 16.3%, 17.7%, 19.2%, 31.5% and 32.9%, so six of seven sat beyond the 15% limit the review now enforces. In the two runs that followed, on 1 and 2 September, it is 5.5% and 2.0%.
- Decision
- Screener workbooks are parsed deterministically from the raw Data Sheet, and the derived lines (total expenses, operating profit, EPS, balance-sheet totals, trailing twelve months) are rebuilt with Screener's own formulas. The per-sheet LLM path stays only as a fallback for workbooks that do not fit.
- Why
- The first version extracted sheet by sheet with an LLM. In many downloads the formatted sheets are formulas with no cached values, so the reader saw empty cells and the LLM path silently extracted nothing. The formatted P&L also carries 'Best Case' and 'Worst Case' forecast columns. One of them was read as a period, and a fake -24.5% trailing revenue growth made it all the way into a final verdict. By my notes that path took 4 sequential LLM calls and 259 seconds on one workbook. The traced run in Figure 5 has no extraction call at all.
- Tradeoff
- The parser is tied to Screener's workbook layout. A layout change breaks it, where the LLM path would have absorbed the drift. A whitelist on period labels is the second line of defence against forecast columns.
- Decision
- The seven specialists, the debate, the brief and chat all run on the light model, gpt-5.6-luna. Only the verdict runs on the heavy one, gpt-5.6-terra, at medium reasoning effort. A light node whose output fails validators in code is re-run once on the heavy model, with the problems listed in its payload.
- Why
- Three configurations in three weeks. The first was an accident: through .env drift the 'heavy' tier was the cheapest model, and the light tier was an older model that was both weaker and dearer. The second put the heavy model on financials, valuation, debate, verdict and chat, and my notes put a first run at about $0.60 to $0.80 at list prices. The third is this one, after a review found that three heavy calls plus the debate were about 75% of a run's cost, for judgment that the validators and the verdict pass already police.
- Tradeoff
- The light model's long-context recall is weak, so the annual-report extraction retry still escalates. Any change of tier or effort invalidates that module's cache, so the next run of every workspace is cold and full price. And the saving is an estimate: my notes say about $0.45 down to $0.15 to $0.20 a run at list prices, and I have not run the cost report since the change.
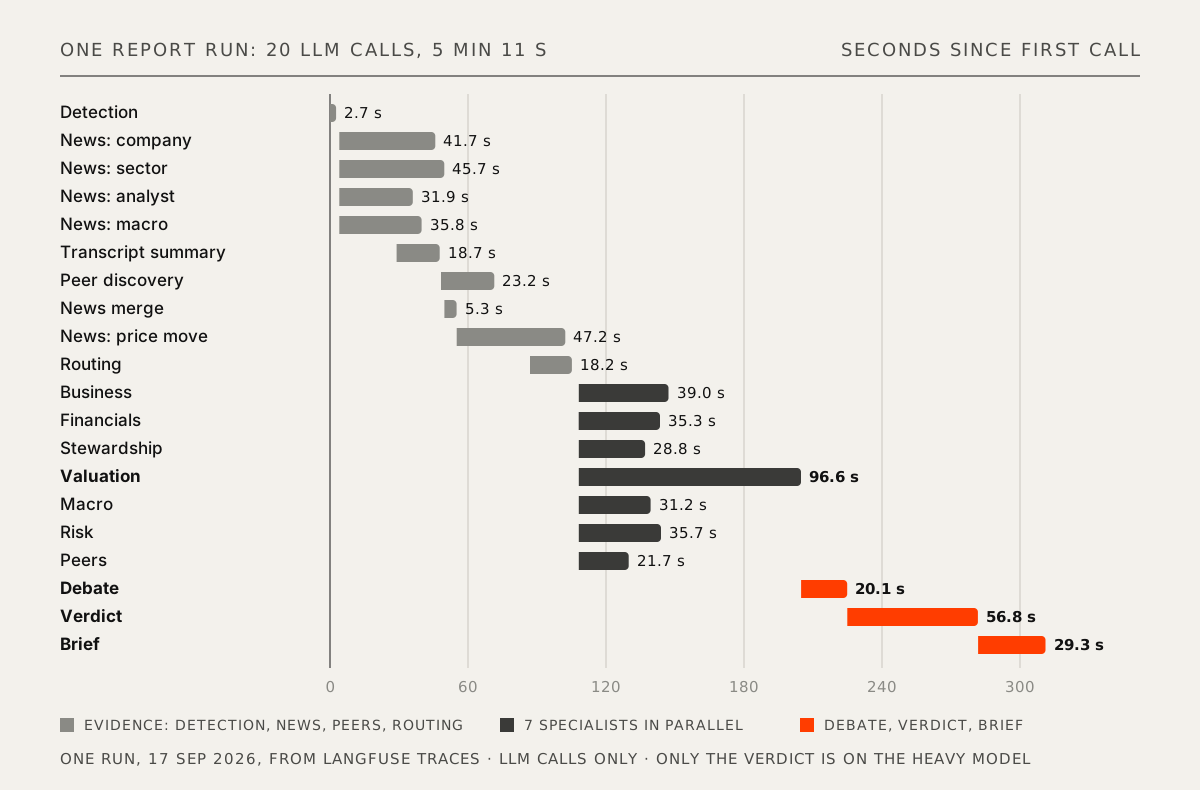
The validators that trigger an escalation are all structural. More than 40% of a node's cited points reference ids that do not exist. No point survived even though evidence was there. A required field is blank. Or the node said "unknown" where its evidence slice carried the number. In the two stored runs that followed the change, on 1 and 2 September, no node escalated. The run traced in Figure 5 shows the same: one call per node, 19 of its 20 calls on the light model, and no revise call after the verdict.
- Decision
- Nodes are plain callables with declared dependencies, checked with Kahn's algorithm and run in topological waves on a thread pool. A failed node degrades the report instead of sinking it, and cancel is polled between waves. The whole runner is 119 lines.
- Why
- A graph framework is the usual way to get guaranteed termination, observability and typed state. At decision time this project had exactly two agentic loops, one user and no concurrency across tenants, so hard loop caps in config, dataclass state and a logged stop reason gave the same guarantees.
- Tradeoff
- No checkpointing, no resume, no pause for a human. My own notes said to revisit if parallel fan-out arrived. It arrived within a day, the graph later grew to 10 nodes, and the answer stayed a hand-rolled runner. LangGraph was rejected on paper. I never built or measured the alternative.
I had used LangGraph on VeriStream AI a few months earlier, so this was a choice and not unfamiliarity. For a fixed graph with one user it was the smaller thing to own.
- Decision
- The first build shipped its own LLM call-log table, ops endpoints and an ops dashboard page, as my plan specified. I removed all three the same day and moved tracing, cost and prompt versioning to a self-hosted Langfuse.
- Why
- What I wanted from observability was a purpose-built platform, not homegrown bookkeeping. Self-hosting keeps filing data on my machine, and the OpenAI drop-in wrapper made it close to a one-line change. Live prompts are served from Langfuse with local prompt files as seeds and offline fallbacks, and the prompt version is part of the cache key, so publishing a new prompt invalidates stale cached answers.
- Tradeoff
- Six more containers on top of the app's three, with ClickHouse taking most of the memory. Prompt edits happen in a UI, so the local fallback files go stale unless I keep them in sync. And its cost figure under-counts: it prices cache-write tokens at zero and never sees the web-search fee, so it showed $0.22 for a run my notes put at about $0.45. I wrote a separate script that re-prices from ClickHouse.
The traces paid for themselves on day two. One review of a run produced most of the pipeline's current shape, and Figure 5, a run I traced on 17 September 2026, still shows it. Reasoning effort is set per module, after the traces showed reasoning tokens were more than half of a run's cost: by my notes document detection had taken 11.4 seconds and 576 reasoning tokens, and in Figure 5 it takes 2.7 seconds and none. A sequential news agent with up to five refine loops, whose sweeps ran 52 to 113 seconds each, became parallel angles and one merge call. In the trace of 12 August that was three angles of 14 to 17 seconds each. In Figure 5 it is four angles of 32 to 46 seconds, which cost 46 seconds of wall clock between them. A fifth angle runs only after a large price move, as it did here. Ticker resolution by LLM and web search, once 24 seconds on the critical path, is absent from the figure: the detection call read the exchange symbol off the filing cover.
Results
None of those is a business outcome, and there is no measured one. There is no returns tracking and no usage analytics, and the only user is me. What I can say from use is that a first read on whether a stock deserves more research went from about an hour to a few minutes, by my estimate and never timed. The part I lean on most is the read on earnings calls: the per-transcript summary with its management-tone label, and the stewardship specialist that reads guidance history across calls.
As of 2 September, the 28 stored runs covered 18 stocks and 65 uploaded files. Their stances were 22 wait, 4 enter and 2 avoid. All six calls that were not "wait" date from 17 to 20 August. The 12 runs from 21 to 30 August were all "wait", which is what sent me looking for the bug in decision 1. The two runs straight after the fix, on 1 and 2 September, were also "wait". The difference was the distance to the entry level, as above. The run in Figure 5, on 17 September, is not in those counts. It came back "avoid" at medium conviction, the first call since 20 August that was not "wait". That is one run, and I do not claim the fix ended the streak. None of the 28 runs had a node error. The rejected and kept counts cover slightly different sets of nodes, so treat 280 against 1,522 as a rough proportion.
The traces behind Figure 5 also show the gate at work. Comparing each node's output with what the next node received, eight points were dropped on the way. Four cited a document chunk id with a few characters wrong, two wrote news_digest where the legal id is news:digest, one shortened a computed id, and one invented an upstream id. Every one of those claims read as plausible.
The run in Figure 5 took 5 min 11 s from the first LLM call to the last, which excludes upload, parsing and indexing. It is one run, and the time is not evenly spent. The valuation specialist took 96.6 seconds, on the same model and with a similar output size as its six neighbours, which all finished within 39. The debate waited almost a minute on that one call, and I do not know why it was slow. The verdict, the only heavy-model call, took 57 seconds, and the price-move news angle ran for 47 seconds after the merge. By my notes an early version of the pipeline took 6 min 17 s for 17 calls. After the trace review on day two, the run of 12 August made 12 calls in 85 seconds. The run in Figure 5 makes 8 calls that one did not: a fourth news angle, the transcript summary, peer discovery, the price-move angle, routing, the stewardship and peers specialists, and the brief. That is one run each, on different companies and different models, so I do not read the three figures as a trend.
Cost is where I have to be most careful. The per-run dollar figures in the decisions above are list-price estimates from my own notes. What OpenAI actually billed across my whole personal organisation from 8 August to 17 September 2026 was $2.17, and that account also serves other projects, so it is an upper bound for this one. The export shows no spend after 2 September, so it does not include the run in Figure 5. Nearly all of it is web-search fees. Every daily total is within a fraction of a cent of a whole number of cents, which at one cent a search is about 216 searches and almost nothing else. Token charges came to close to zero, and I do not yet know why. So I can say what I was billed. I cannot say what a run costs.
The Figure 5 run shows the tracing tool's under-count from decision 5 directly. Langfuse priced the run at $0.10, of which the single heavy-model verdict call was $0.046. About 152,500 prompt tokens in the run were logged as cache writes and priced at zero, and the 14 web-search tool calls the run made, 13 searches and one page open, do not appear in the figure at all.
Two smaller results. The report prompts grew to 18.3k words by my notes and were cut to 9,873, counted. And after a friend who works as an equity analyst read one exported report and found it far too long, with valuation discussed in five places, I added a client-brief layout: 3,235 words and 18 footnotes against the full report's 6,875 and 58, for the same sample company.
Looking back
The share-basis bug was there from the start: the ten-year price fetch asked for adjusted prices and nothing adjusted EPS. My tests could not catch it, because every one of them fakes the market data. It surfaced as me complaining that every stock came back "wait", not as a failing test. One test on a recorded price history that includes a split and a bonus issue would have caught it on day one.
It had company. A "10-year median P/E" was a 3-year one, because the price history fetch covered three years. Dividend yield read as 86% after the market data library began reporting percent instead of a fraction. A PEG of 0.09x was printed next to "Valuation: expensive", because the library's PEG used one quarter's year-on-year growth. My tests wrote events into the production Langfuse project until the test config disabled tracing. And a leadership change at one company never reached the verdict: five nodes received no news at all, and the sweep prompt told the model to skip routine board-meeting notices, which is exactly how such a change is disclosed.
The run in Figure 5 shows the share basis is not finished either. The fair-value band multiplies by the newest annual EPS line in the workbook, although my own code comment says the band is anchored on trailing EPS. That export had no EPS line for the latest full year, so the band sat on earnings a year old while trailing EPS was about 2.5 times higher. And the dilution check skips a bonus issue only when the workbook carries a bonus-shares line. This one did not, so a jump in share count that was mostly a bonus or split, already recorded in the split factors the price data carries, was flagged as dilution. "Dilution" is named in that verdict's basis for the stance.
The review loop's first real run shows its weak spot. The check for governance headlines is a regex that includes the central bank's abbreviation. It flagged a macro headline that merely quoted the RBI as an unaddressed regulatory item, alongside one true positive, and the pair triggered a heavy-model revise call. A regex cannot tell a regulator named in a macro story from a regulatory action against the company.
I was careless with the project's own history. I kept almost no record of how the code changed over three weeks, and the reasoning behind it survives only because I wrote each decision down as I made it, 11 notes in all. Nothing runs the tests automatically, although they take 19 seconds, and the frontend has none. And there are no backups: the 28 reports and 65 uploads exist on one machine.
What I would change. Keep a proper history of the work from the first day. Fill the golden extraction set and the retrieval query set before adding features, since both harnesses are already written. Add the split-and-bonus integration test. Make the dilution check read the split factors, and fall back to trailing EPS for the band when the latest annual line is missing. Record each run's cost and latency per node in the run itself, so cost claims do not depend on a tracing tool that under-counts, and keep the output of every evaluation run so that before and after are measured and not remembered. Replace the governance regex with something that reads the headline. And run the tests automatically on every change, which at 19 seconds is nearly free.
Want to talk? Say hello.
A project, a question, or just to compare notes. I read everything and write back within a couple of days.